Graph theory, a mathematical concept, is helping solve problems in transportation
Suppose you have to prepare an exam schedule for 20 courses in a class where each student is enrolled in five courses – some core, some elective. How do you prepare the schedule so that no student faces overlapping exams? If you pose this problem to a mathematician, the answer you’ll get is: use graph theory.
“One way to study this is to think of it as a graph,” says Vineeth Chintala, an INSPIRE faculty fellow at the Department of Mathematics, IISc. Each course is represented by a dot (node) and a line (edge) joins two nodes if a student happens to have taken both subjects. If an edge exists between two nodes, the courses corresponding to these nodes cannot have tests in a single time slot. This is what graph theory is all about: converting information to graphs or networks in order to solve a problem.

Graph theory is not just an abstract concept. It has been used to solve many real-world problems. In biology, for example, it can be used to find relationships between species and analyse gene regulatory networks. Networks are also used for training machine learning models, and in marketing for understanding social connections based on mutual interests.
At the Centre for infrastructure, Sustainable Transportation and Urban Planning (CiSTUP), researchers have been using graph theory to untangle problems unique to cities like Bangalore, such as traffic management and efficient movement of electric vehicles.
One prominent challenge is the transit routing problem: How do you go from point A to B in the most efficient way possible in a public transit network? “[And] once you’ve found a set of candidate paths, how do you predict which path would be chosen by a traveller?” asks Prateek Agarwal, PhD student at CiSTUP, working with Tarun Rambha, Assistant Professor.
A recent paper by Prateek and Tarun focuses on a solution to this problem. All bus stops and route connections between the stops together create a network. Conventional solutions use variants of a mathematical tool called Dijkstra’s algorithm to find the shortest route between two points in a graph where each edge has a weight – the cost of traversing that edge. But travellers will also be concerned about the number of changes in routes they have to make, which is not addressed by Dijkstra’s algorithm.
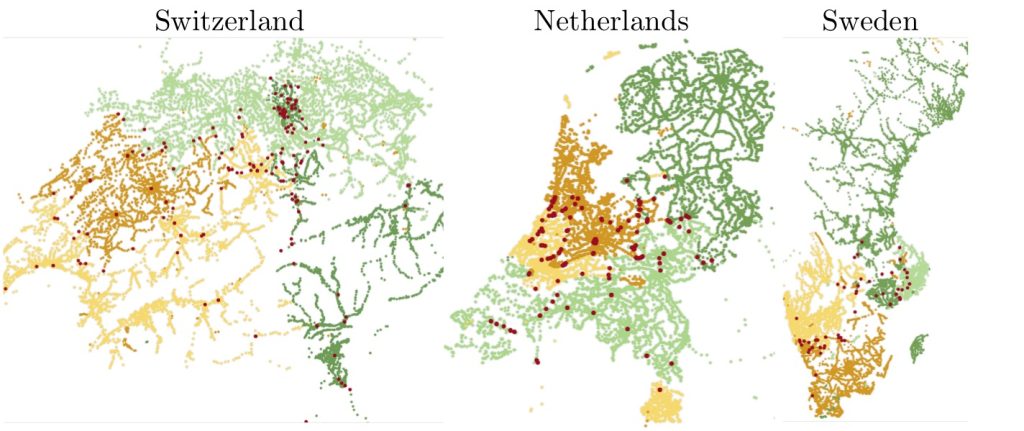
Prateek and Tarun, instead, propose an alternative: an approach called Hyper-graph Based Transit Routing. The network is first divided into regions. “We don’t just partition it into, say, four regions, but we again partition them into smaller regions,” adds Tarun. Each region has certain boundary points or cutstops. The efficient paths between these cutstops are then computed and saved. This boosts the query time. The algorithm only needs to calculate the shortest path between the user and nearby cutstops.

“One way to partition a graph is to look at strongly connected components of the graph,” explains Vineeth.
But in fully connected graphs, we can create partitions which cut the fewest number of edges. A transit route is a series of edges that connect a set of stops. Imagine representing a transit route as a node in a hypergraph, which is different from a regular graph where each edge connects only two nodes. If two or more routes intersect – have a stop in common – the location of intersection becomes a hyperedge. The hypergraph provides a more comprehensive cluster representation of the multiple routes that make up the transit network. When this hypergraph is partitioned, hyperedges that separate the partitions form the boundary points or cutstops used in preprocessing
Such hypergraph-based candidate routes can then be fed to a model to predict passenger flows using travel times, number of transfers, crowding levels, walking and waiting times, and so on. “Suppose a person is travelling from point A to point B and they have five paths available,” Prateek elaborates. “Now let’s say we have a model which predicts that a person will choose path number one. Now for every person, I can predict what they are likely to pick. Once I have that, I can simulate them in the network as a person boarding the bus [operating in that route], as long as the bus is not full.”
This type of approach offers massive performance gains. For example, in some country-level datasets, multilevel partitioning reduces preprocessing calculations by 53%, and their method is more than 90% faster than conventional methods.

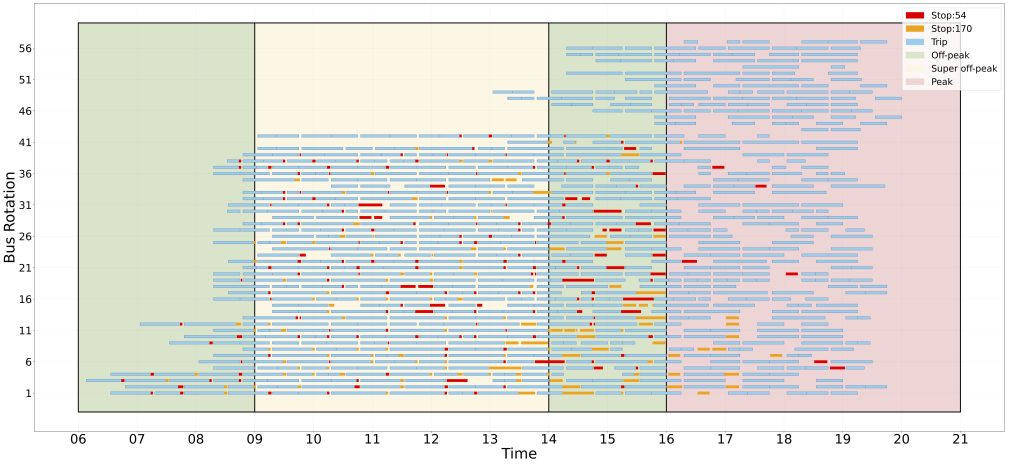
Tarun’s lab has also extended graph theory to study Electric Vehicle (EV) mobility. Unlike gasoline-based vehicles, EVs need to be charged at regular intervals, and charging is not as fast a filling the tank. A recent study led by Rito Brata Nath, a PhD student in his lab, tried to solve the problem of charging and trip assignment for electric buses. One can model a network with trips as nodes and edges connect two trips if they are compatible. Assigning buses to vehicles can be viewed as a problem of matching on this graph.
Graphs are used in more than one way. For example, to estimate maximum grid capacity at charging locations, their paper finds the maximum number of buses present at a charging station at a given time. A graph is created where each node represents an instance of the bus waiting at the charging station and an edge is added between two nodes if any of their charging time windows overlap. “To address this efficiently, we identify cliques,” Rito explains. A clique is a subgraph in which an edge connects every vertex to all the other vertices in the subgraph. This allows an easy estimate of the grid capacity of various charging stations and thus helps in deciding whether we need more charging stations or not.

But implementing graph theory isn’t without hassles. “One is that you don’t always have the data and sometimes the data is outdated,” Vineeth says. Human behaviour is another aspect that needs to be taken into account. “At least for my problem, a lot of assumptions were made. For example, we assume that the timetable does not fail. So, if a trip starts at 8 am and it ends at 9 am, it will start at 8 and end at 9. But in a real world situation, delays are very common,” Rito says. “You always lose some information when you translate to real world problems.” In the future, he plans to work on addressing this challenge.


