Projections and simulations have helped provide a better handle on understanding disease spread and management
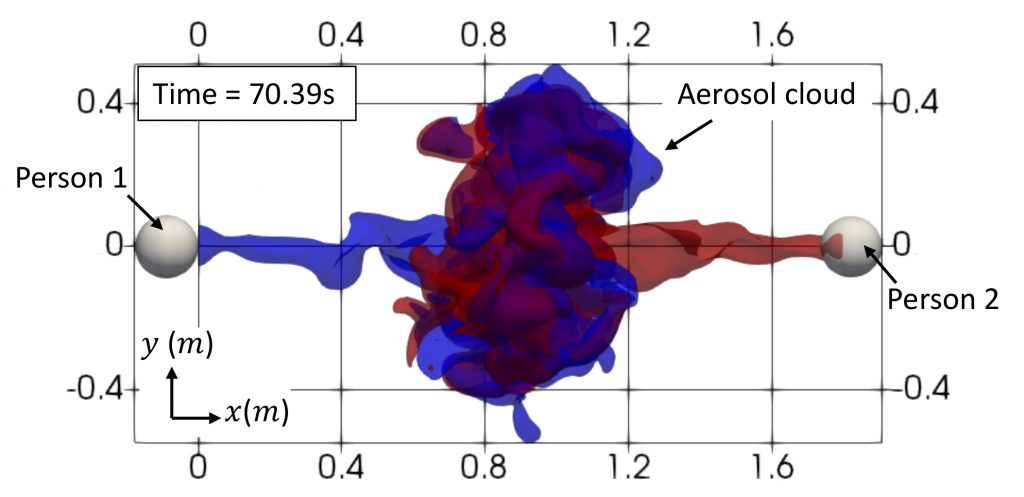
(Image courtesy: Sourabh S Diwan)
In January 2020, India reported its first cases of COVID-19 caused by the now infamous SARS-CoV-2 virus. It was declared a pandemic by the World Health Organisation on 11 March 2020. A year and a half later, India is still struggling to escape from the clutches of this deadly disease. With a potential third wave lurking around the corner, how do we prepare for what’s coming?
In this quest for better preparedness, modelling and simulations continue to play an important role. These models are built based on the current understanding of disease spread. Factors such as the pathogen’s virulence, the number of people affected so far, the severity of infection, the mode of infection spread and so on are typically considered while building a model. Policy makers have relied on such models to devise suitable interventions that can prevent or reduce dangerous outcomes. Many IISc researchers have also been involved in developing such models, simulations, and analysis tools for managing the response to COVID-19.
For example, during the first wave, a model and dashboard that projected the requirement of medical inventory like oxygen supply, masks, PPE kits and ventilators was developed. Other models studied the effectiveness of random testing, contact tracing, lockdown-like restrictions, and isolation on the spread of the disease.
One of these simulations looks at air flow patterns to understand how COVID-19 can spread from one person to another. Scientists have shown that COVID-19 is primarily transmitted via droplets from an infected individual. A research group led by Sourabh S Diwan, Assistant Professor at the Department of Aerospace Engineering (in collaboration with International Centre for Theoretical Sciences, Bengaluru and NORDITA, Sweden) has been studying the patterns of air ejected when a person coughs, sneezes or even speaks, using insights from the analysis of cumulus cloud evolution.
Over the past few months, the team has performed simulations on the SahasraT (CRAY XC40) supercomputer to examine COVID-19 transmission through transport of aerosols, which are tiny droplets that largely follow the air flow generated during speaking and can remain suspended in the air for hours even after the speech flow has died out. For instance, their simulations show that when two people of the same height are engaged in a short conversation, the jets coming out of their mouths face mutual opposition after travelling a certain distance, and therefore only a small fraction of aerosols released by one person reaches the other person’s face. This considerably lowers the risk of infection. But if there is a certain height difference between the two people, the speech jets can slide over each other and reach the other person more easily, and therefore carry a higher risk.
Another way of decreasing risk of transmission, the team found, is lateral separation, where two individuals are not directly face-to-face. “[Tilting the] head away by about nine degrees can ensure that even when you’re not wearing a mask, you are generally at a lower risk of infection than when you are looking directly in each other’s faces, especially when you are separated by a distance shorter than six feet,” explains Diwan. He warns, however, that such scenarios are more complex in real life, where factors like the exact phrases used during speaking, cross ventilation, and ambient humidity can also have a direct impact on disease spread.
Another model that has proved useful in policymaking is a partial differential equation (PDE)-based model developed by Sashikumar Ganesan, Professor at the Department of Computational and Data Sciences (CDS) and Deepak Subramani, Assistant Professor at CDS. Their model projects the potential number of infections in the medium-term (>6 weeks) based on the current caseload and multiple scenarios.
An important parameter it incorporates is the age distribution of the population, specifically the age distribution of the infected people, which largely determines the preparedness required from healthcare systems. It also includes parameters such as rate of testing, the loss of protective antibodies over time, and extent of interaction between individuals. The model then uses this information to predict the disease spread and its severity. Crucially, the model predicts how cases will rise or fall under different scenarios, such as no lockdown, complete lockdown, night or weekend curfew in some areas and so on. This capability is important for science- informed, data-driven policymaking.
“The projections are good for the next 4-6 weeks, and once every 4-6 weeks, we update the parameters, introduce new scenarios and evaluate our model’s performance since the last update,” says Subramani. Ganesan adds that they have discussed and shared their projections with authorities involved in COVID-19 management at both the local and national level.
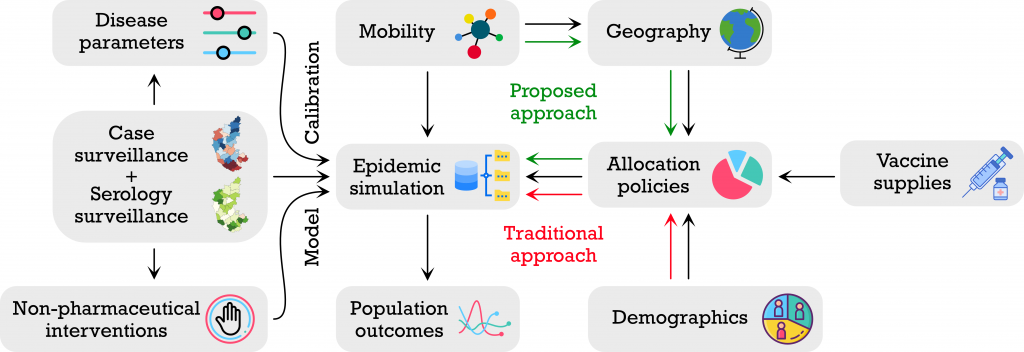
Yet another recently developed model provides suggestions on how to manage vaccination strategies. Led by Rajesh Sundaresan from the Department of Electrical Communication Engineering, in collaboration with the Indian Statistical Institute and University of Virginia, this model incorporates seroprevalence (the extent of population exposed to the virus) and seroreversion (the extent of previously infected population which is now susceptible) while making decisions on different vaccination strategies. It evaluates the vaccination requirement and proposes three different roll-out plans, based on population size, seroprevalence, and number of cases – including active or recently recovered infections in a state or district.
Their model shows, for example, that by increasing the number of vaccine doses to about 4 lakh per day in Karnataka (assuming an average of 1 lakh doses per day as the baseline), by 31 August 2021, the case load could be reduced by about 55%, when relatively strict non-pharmaceutical interventions (NPI), like lockdowns, are followed. On the other hand, when the NPIs are slightly relaxed, the case load could reduce only by 37%, and when there are no interventions at all, by 13.5%. “[This model] can help policy makers determine the level of non-pharmaceutical interventions needed to not overburden the healthcare system and come up with good strategies to prioritise vaccination across districts,” says Sundaresan.
But with any model, there are several challenges. A pandemic like COVID-19 is laden with uncertainties, partly driven by new variants and mutants. Any model should try to include the many underlying uncertainties at every step, points out Vishwesha Guttal, Associate Professor at the Centre for Ecological Sciences. He also says that incorporating the most recent data on disease spread, infectivity rates, target population, and so on, as well as genomic surveillance data – which could hint at the emergence of a new strain or variant – are crucial.
The time frame is also important, he says. “One must avoid long-term projections because, at the end of the day, there are many aspects of infectious diseases that are dependent on human behaviour, which in turn can be affected by policies.”


